Ships & Fleets on Water
Track vessels, routes, port congestion, ETAs, and risk zones in one operational picture — from global to harbor-level.
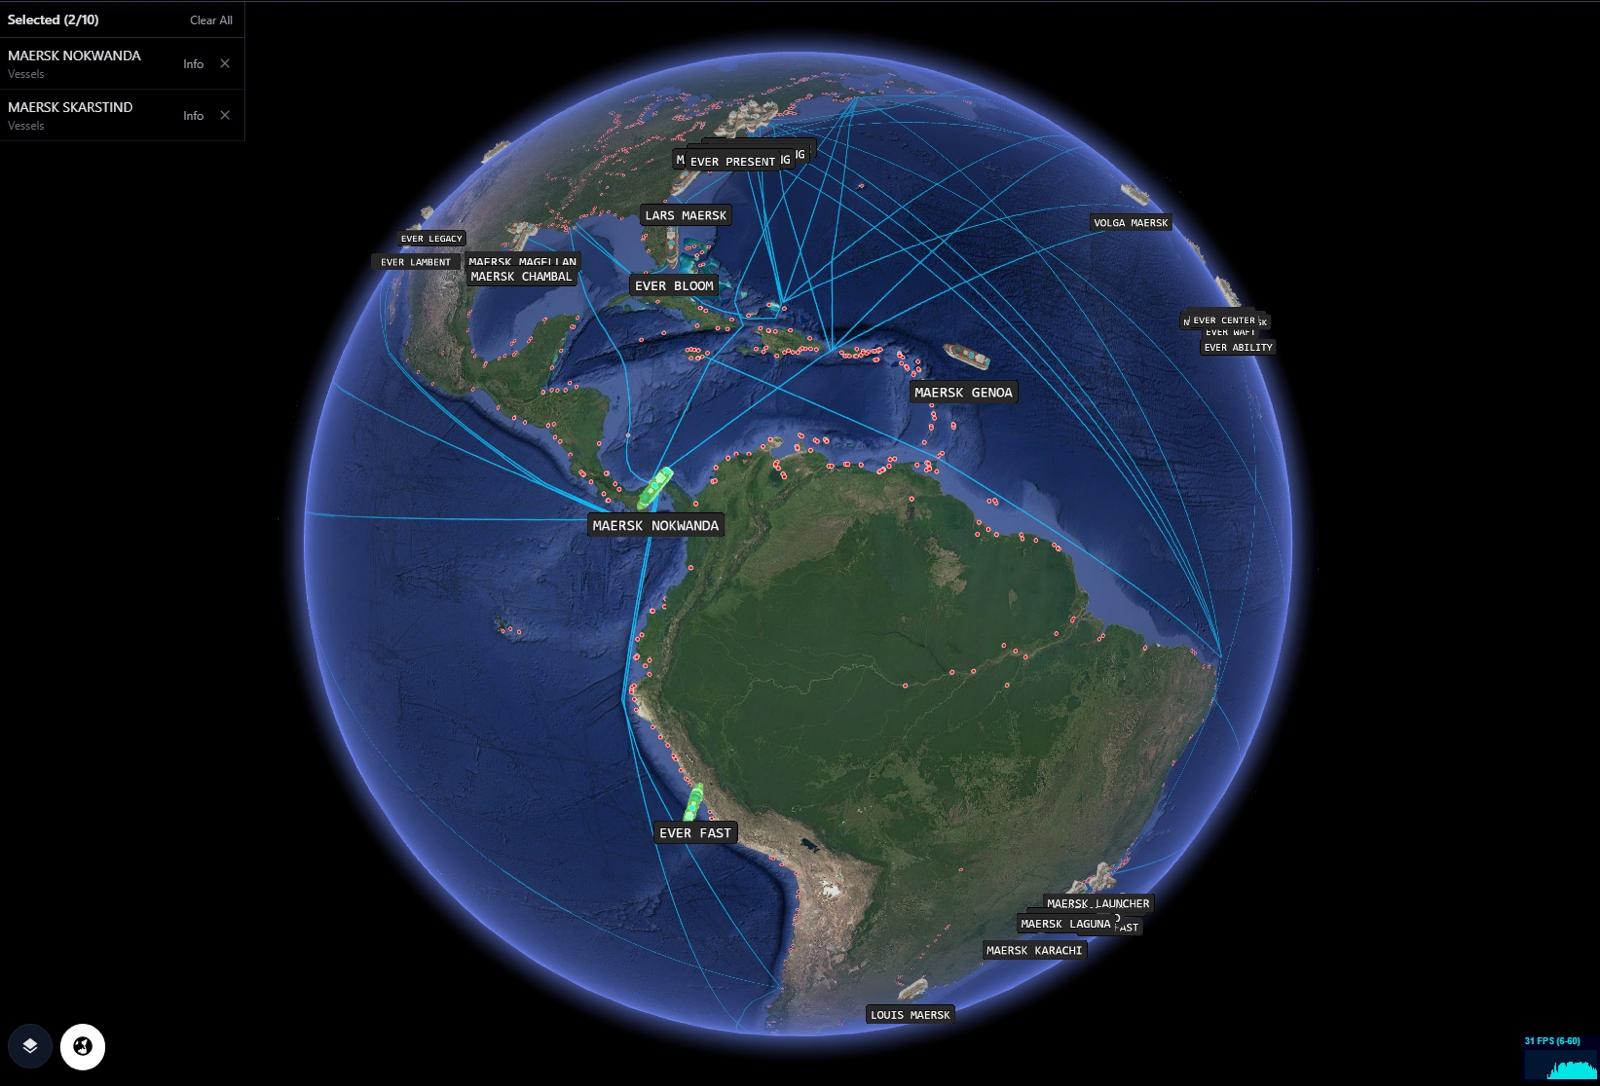
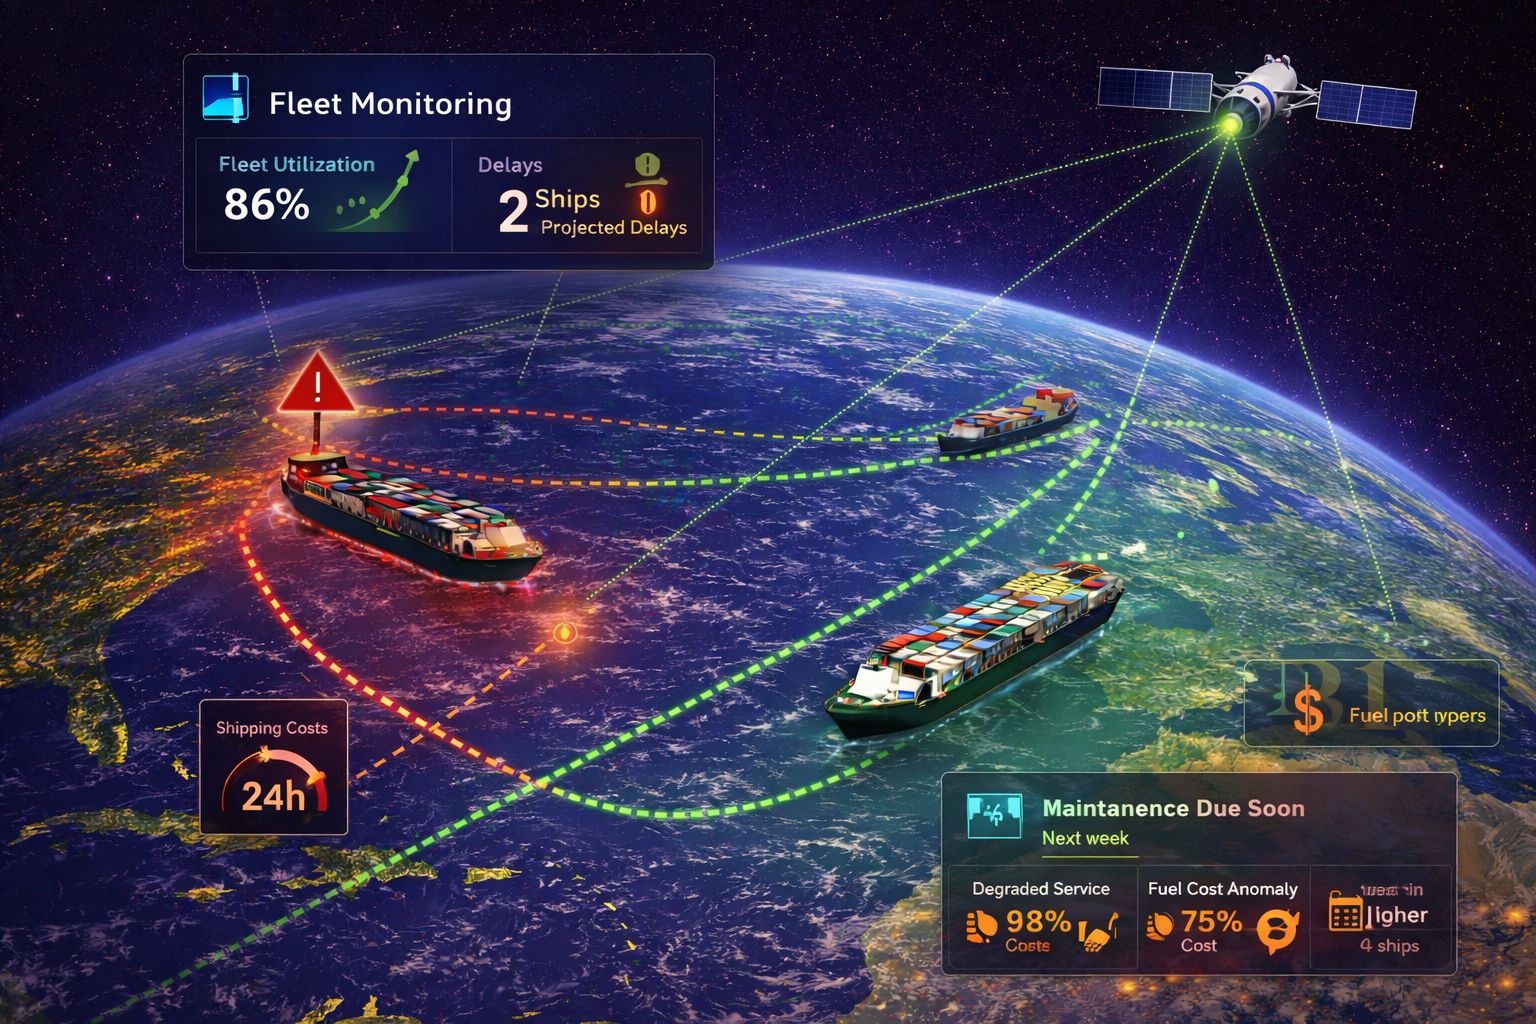
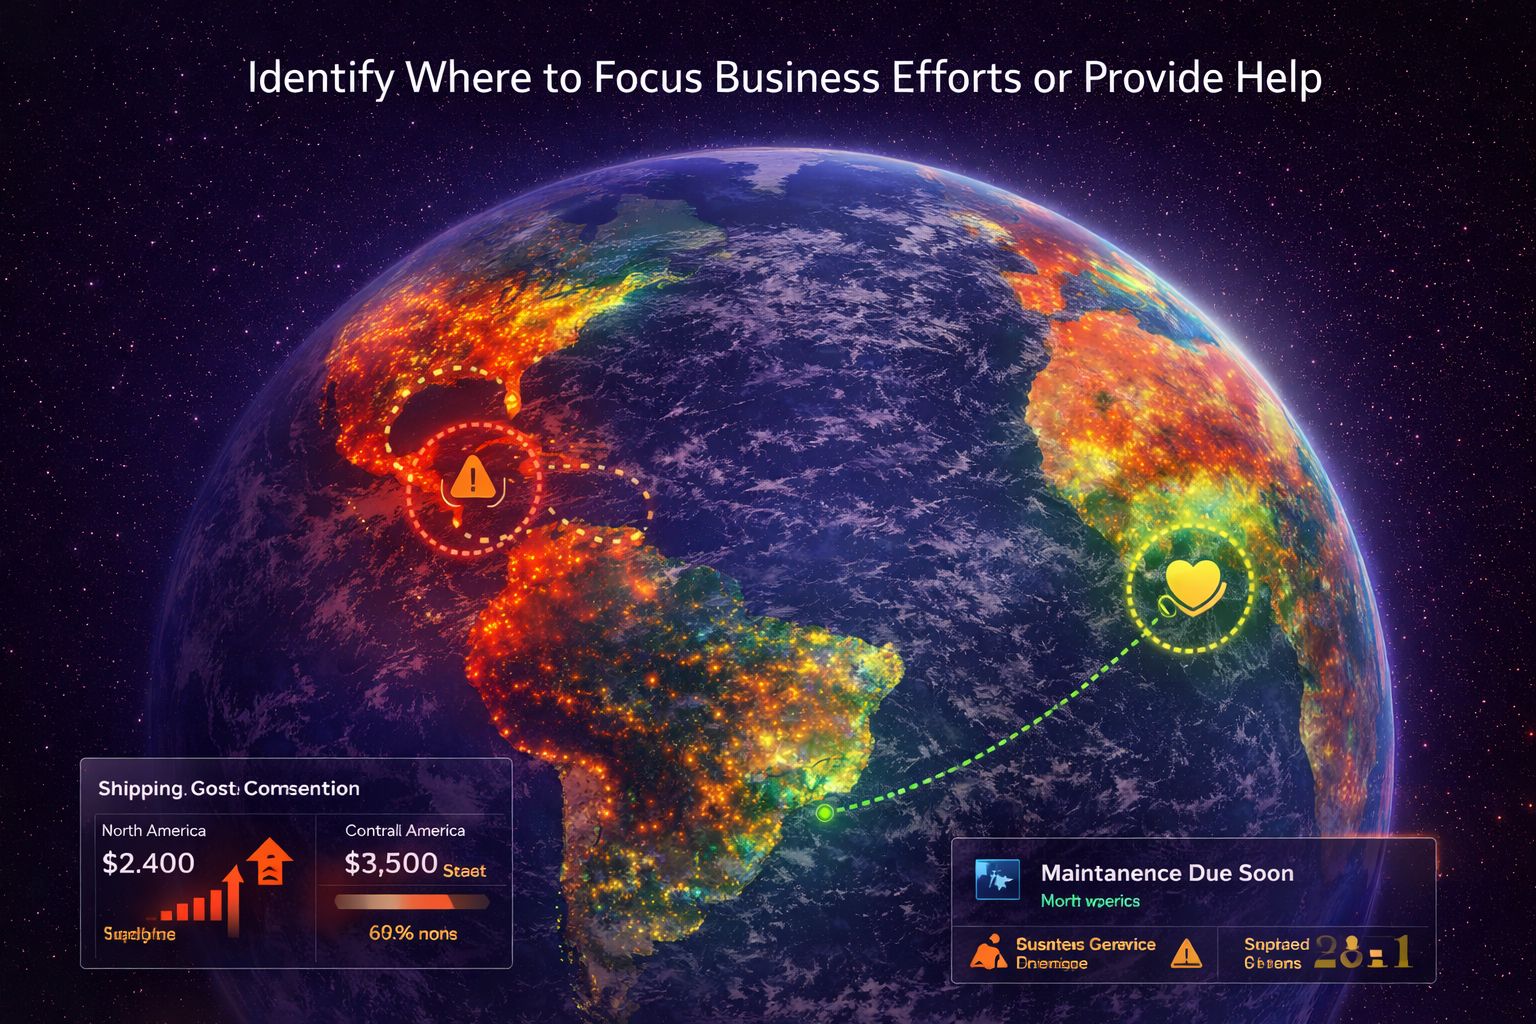
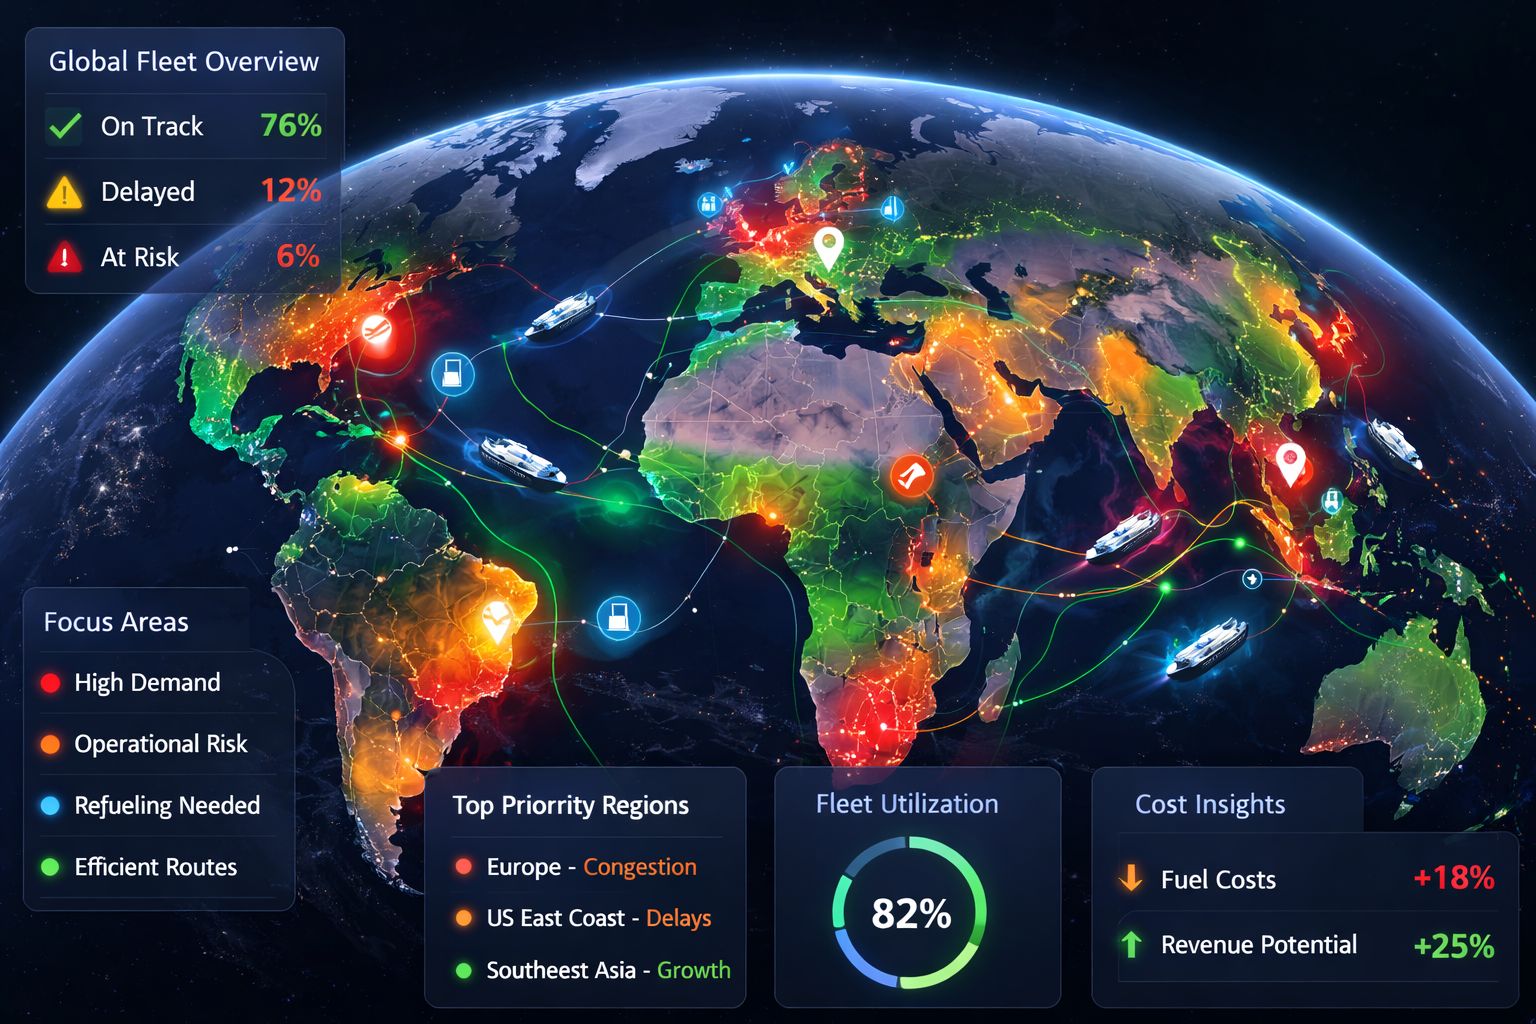
See ships and fleet assets across oceans and ports with real-time context. GRIP 3D fuses vessel position, routes, port activity, ETAs, and risk zones into a single operational picture—so logistics and maritime teams can detect disruption early, coordinate exceptions, and reduce dwell time. Layers can expand from AIS to weather, piracy advisories, and cargo status—turning tracking into decision-grade intelligence.
Maritime ops teams juggle AIS tools, port dashboards, weather, and spreadsheets. The result: slow decisions when routes shift, ports congest, or risk zones escalate.
- AIS shows dots, but not operational context
- Port congestion and berthing data lives elsewhere
- Weather + risk intel not correlated to routes
- No single view for fleet health and delays
GRIP 3D fuses AIS + ports + weather + alerts into a single globe view. Teams see congestion, reroutes, and ETA risks as spatial patterns — not scattered tabs.
- Fleet routes, ETAs, and exceptions on one globe
- Port overlays: berths, congestion index, queues
- Risk zones + weather layers tied to corridors
- Drill-down to vessel details and event timeline
Why this works at enterprise scale
Capabilities
- AIS ingest + vessel metadata enrichment
- Port layers: congestion, berth occupancy, advisories
- Route corridor overlays + reroute recommendations
- Weather and wave-height overlays for safety
- Partner APIs for schedules, cargo, and exceptions
Platform Views
Open for consulting and partner integrations
If you want this use case mapped to your data sources, we can deliver a fast prototype and integration plan — including layers, APIs, and deployment options.